Posts

Inverse Distance weighted (IDW) in QGIS
Image
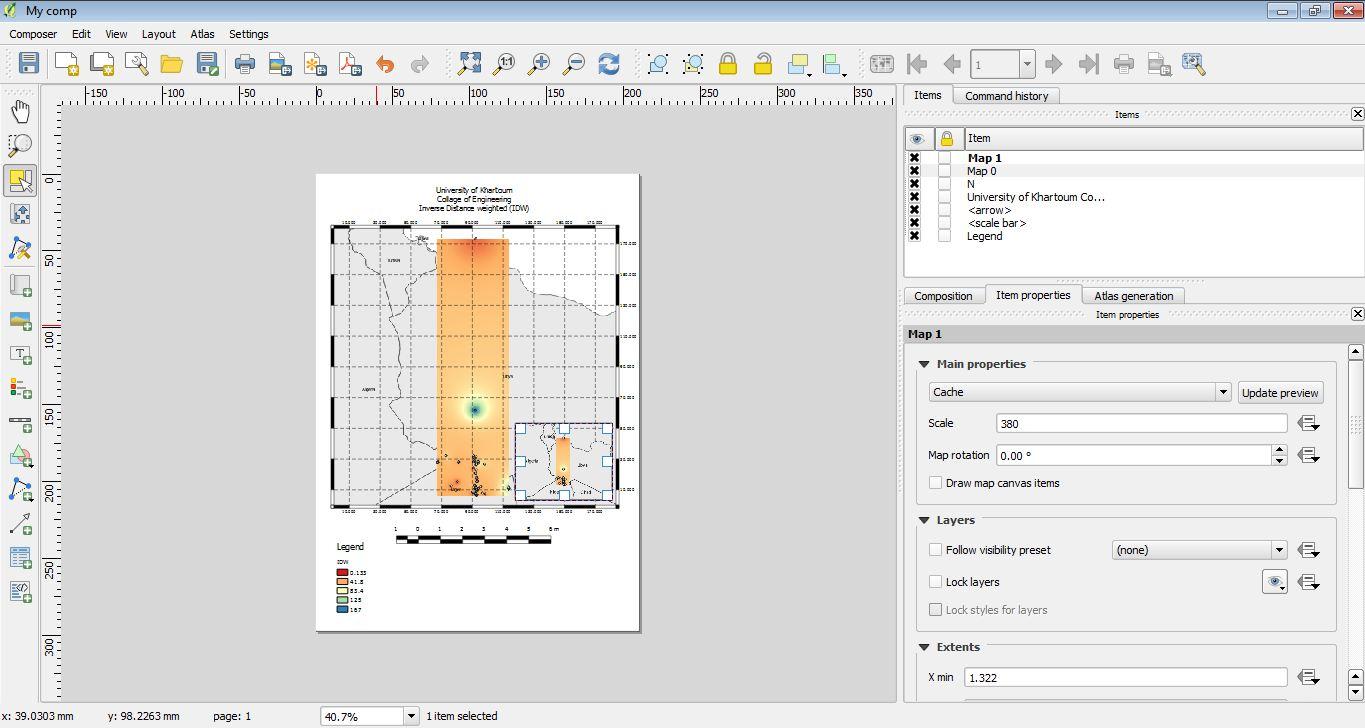
Introduction Inverse distance weighted (IDW) is a type of deterministic method for multivariate interpolation with a known scattered set of points. The assigned values to unknown points are calculated with a weighted average of values available at the known points. The name given to this type of methods was motivated by the weighted average applied, since it resorts to the inverse of the distance to each known point ("amount of proximity") when assigning weights. Practice First, given data were pre-processed and cleaned using Microsoft Excel: Adding data as a vector layer using “add delimited text layer” as follow:  After adding the data, you can save it as a Shapefile for further other processes, and that by “right click” on the layer and select “save as”: Enabling the “interpolation” plugin: Apply...

Digital Elevation Model (DEM)

Image
Introduction: Digital Elevation Model is basically a three dimensional computer graphic representation of terrain or surface, typically Earth or Moon, March and so on. It used as a precursor of orthophoto and is also used as a base for relief map. It could also be defined as a special case of interpolated, continues surface. The term DEM is used generally to describe the height information without any further consideration of the surface, and usually used as a generic term to describe both Digital surface Model (DTM) and Digital Surface Model (DSM), which sometimes all the three terms are used synonymous. Some of data provider such as USGS define them the same way. Also sometimes, DEM is defined as a subset or the most fundamental component of DTM. Or defining DEM as a rectangular matrices (altitude matrix) and DTM as Triangular Irregular Network (TIN) Type s of DTM or, methods of representing DEM: Mathematically defined surfaces. Raster: altitude matrices. Also known as height map. ...

Thissen Polygon (Voronoi) in QGIS

Image
Introduction Thissen polygon is a local interpolators that uses nearest neighbours, as they are of high importance ‘first low of geography’. It gives a quick understanding of the space, and starts by defining a search area around the point being process. The space is divided by polygons with each polygon containing one indiviual point. polygons represent that any location inside it, is closer to the point other than any sample point, Also the size of the polygon depend on the point density. Methodology Using QGIS, Thissen polygon (Voronoi) was applied to data of Sudan Admissions and localities that were obtained from (humenreponse.org). North Darfur was the state of application. A comparison between two different ways of splitting the vector was held, and another comparison between the (GRASS and QGIS Geoalgorithms) Voronoi algorithms. Practice Pre-processing: Downloaded the data. Organized on a folder to ease understanding and management. Add data (vector data) to the QGIS environ...

World Geodetic System 1984 (WGS 84)

Image
WGS 84 is developed by the U.S. Department of Defence, it’s the standard for use in cartography, geodesy, navigation and it’s the most known terrestrial reference system because it’s the reference system for the Global Positioning System (GPS) and that’s the main reason of the high acceptance of the WGS 84 as a primly reference system. Also the U.S. DoD uses it as the standard definition for global reference system for geospatial information. It’s Earth fixed, Earth centred (EFEC) Terrestrial Reference System or a Geocentred datum, based on a set of consistent constant and parameters that describe the Earth’s shape, size, gravity and geomagnetic fields. It’s a global coverage three dimensional Cartesian coordinate system (X,Y,Z), and it’s compatible with the International Terrestrial Reference System (ITRS) also to some extend it can be considered identical to the ITRF. The responsible organization for establishing and maintenance is the National Geospatial-Intelligence Agency (NGI...

International Terrestrial Reference Frame (ITRF)

Image
  Coordinates system are baaed on assumption that the vertical axes coincide with the rotation axe of the earth, that is derived from another assumption that says the rotation axe of the earth is fixed. Although many scientists proved that this assumption is invalid, it still acceptable for some Geodetic application with resolution of 1 cm or more.   The rotation axe actually moves slightly resulting in very small changes on measurements, which taking them into account when high accuracy is need specially in applications that require accuracy of milometer or less such as detecting and measuring curst movement.   Also the over all shape of Earth change continuously so when the earth’s curst is measured it most be referred . Photo source   For that the International Terrestrial Reference Frame (ITRF) was developed. And an international organization called: International Earth Rotation and Reference Systems service (IERS), which was created in 1988, measure the r...

Datum

Image
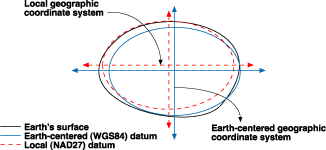
  it defines the relationship between a local and a global three dimensional coordinate system of the same type, and it is defined as a re-position of a reference ellipsoid to be more accurate in representing a specific area . it also called local datum or national datum or just a datum.   Because an ellipsoid may be a best fit globally and the difference between the geoid and ellipsoid (n) be very minimum (globally) but not necessary for a specific area (country for example) so that a datum is created.   As every country wish to have an ellipsoid that is much accurate and close to the real surface of its land, some modifications may be applied to the previously best fitting global ellipsoid (correction for the ellipsoid parameters: a, b or e and f) or global reference system. Photo source   And that by taking a point and consider it as a datum centre point (datum origin point, it’s fixed and all other points are calculated from it), by assuming that th...

Application of Thermal Remote Sensing in Fish Harvesting

Image
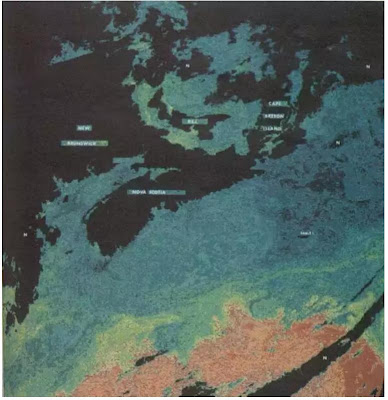
Introduction : Using satellites in fish harvesting is due to the great advantages they provide such as the wide range capture of see surface “large coverage”, temporal resolution and data are independent from weather. So that remote sensing has real impact on uncovering the relationship between fish distribution and surrounding environment. The main objective of using remote sensing is to reduce search time and increase catch rate. There are two methods to apply remote sensing data: Indirect Method: measuring oceanographic and environmental factors that correlate with fish habitat, such as ocean colour, sea surface temperature (SST), wind stress, current data, and other environmental characteristic that affect fish habitat Also, known the fact that fish correlate with nutrient-rich waters. Direct method: by spotting fish appearance.  Measuring the environmental factors is much easier than spotting the appearance of a fish. And the main source for fisheries management is thermal...